
Full-time project · Android
Android data visualization
An Android dashboard for business activity and system health.
Role: Android developer
- Android
- Data visualization
- Charts
- System monitoring
- Alerts
Overview
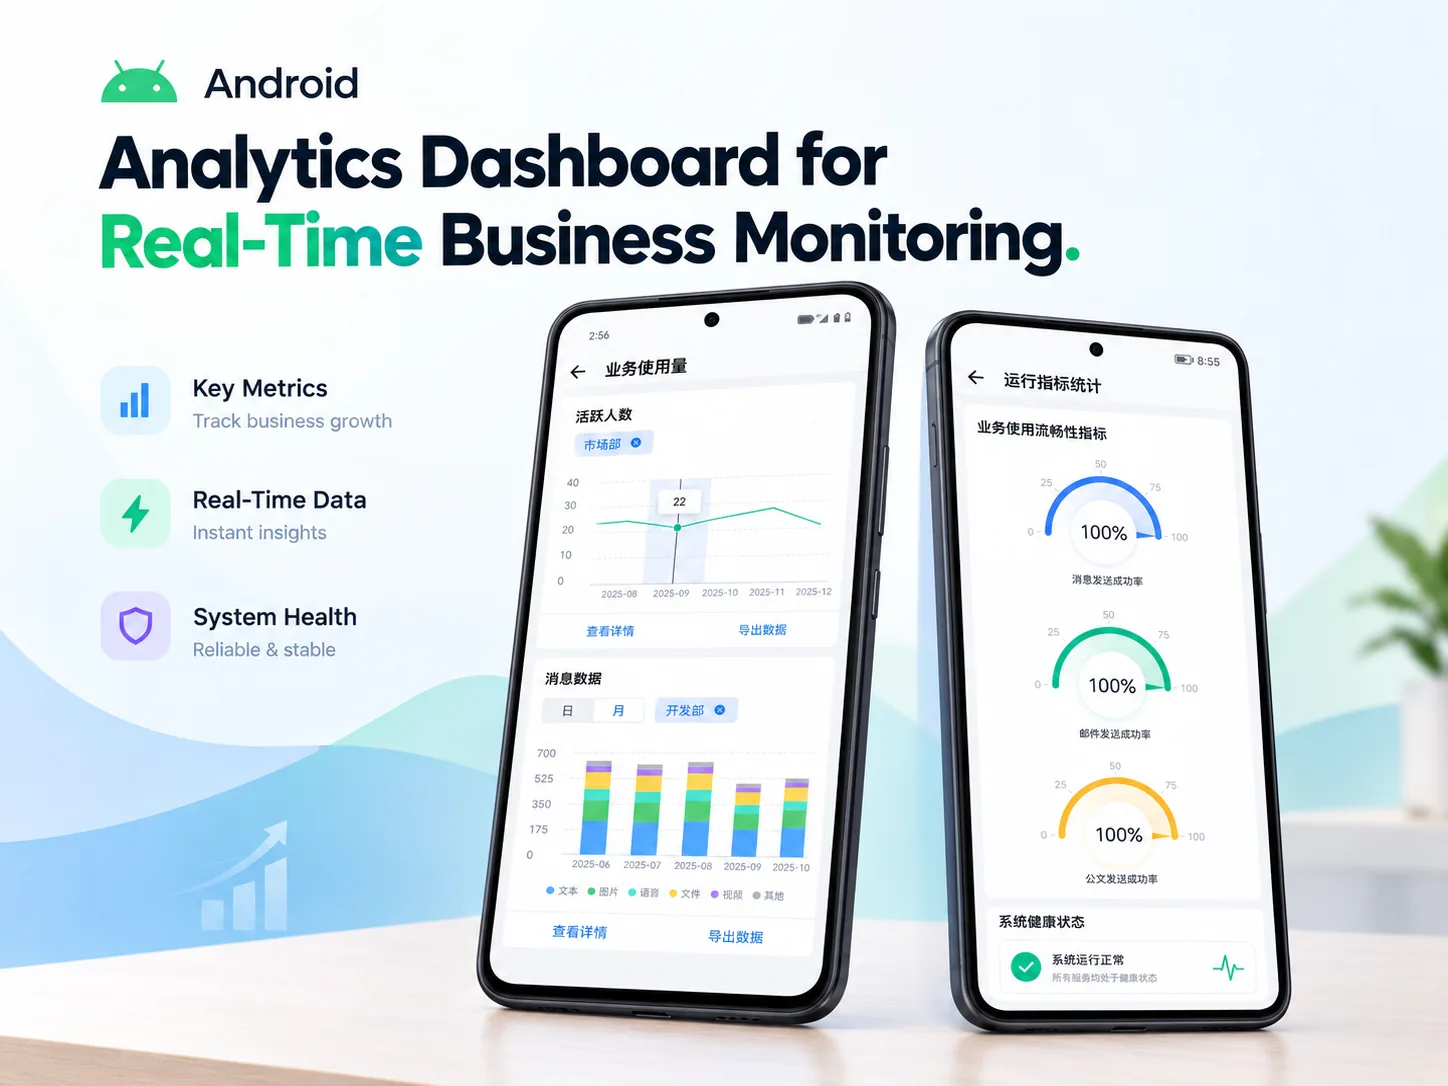
This Android dashboard brings business and system data into one place. It tracks daily, weekly, and monthly active users, shows how often core business APIs are called, and presents real-time security and system health metrics. Smart alerts help the team spot unusual activity quickly.
What I built
- Built Android views for user activity and core business API usage across different time periods.
- Presented security and system health metrics in charts and status views.
- Added alerts to notify the team when something looks off.
Activity over time
Charts make daily, weekly, and monthly usage patterns easier to compare.
Health at a glance
The dashboard brings API activity, security signals, and system health into one view.
Timely alerts
Notifications draw attention to unusual conditions so the team can investigate sooner.
Inside the dashboard
Select a screenshot to view it larger.
Android dashboard · 1 of 5
See it in motion
A short walkthrough of the Android analytics dashboard.
Watch on YouTube (opens in a new tab)